

Visualizing Virginia's Commute
Commuting patterns can reveal important information about communities, such as how people access jobs, how regions are linked economically, and where transportation and housing investments might be needed.
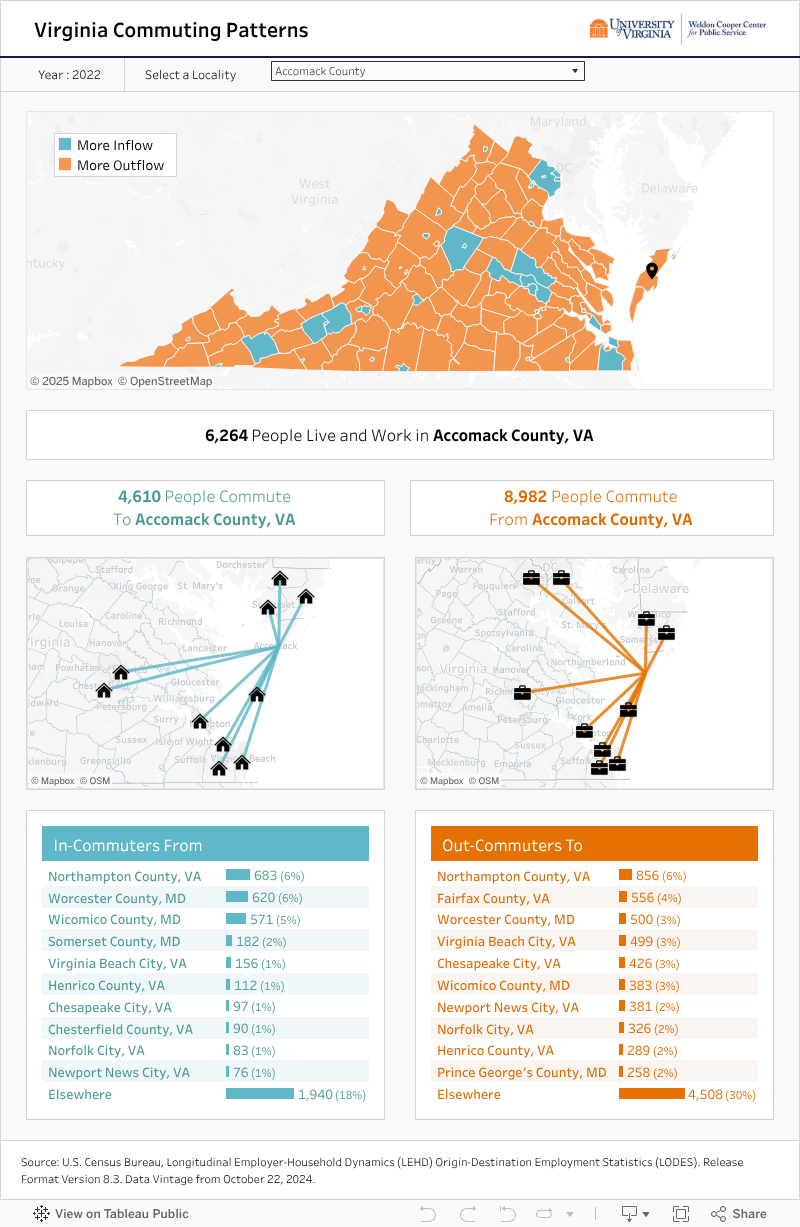
To help illuminate commuting flows within Virginia and its 133 localities, we created the Virginia Commuting Patterns dashboard. We used the most recent commuting data, which is from the U.S. Census Bureau’s 2022 Longitudinal Employer-Household Dynamics (LEHD) Origin-Destination Employment Statistics (LODES).
About the Data
- The latest data is from 2022.
- The LODES data includes jobs covered by state unemployment insurance and federal administrative records, excluding military personnel, self-employed, informal workers, and some federal employees for security reasons.
- Job locations reflect the employer’s address, which may not match where work is performed, and the data does not distinguish between remote, hybrid, or on-site roles.
Out-Commuting and In-Commuting
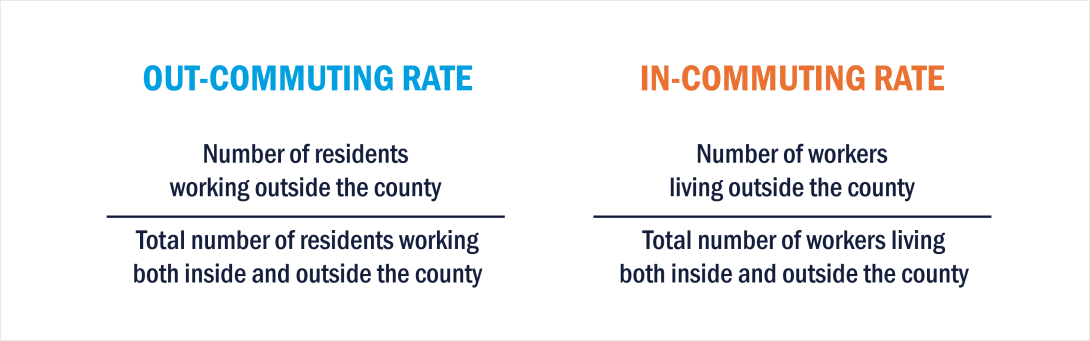
The out-commuting rate measures the share of employed residents who work outside their home county. This is calculated by dividing the number of residents commuting out by the total number of residents working both inside and outside the county. The in-commuting rate reflects the share of workers in a county who live elsewhere. This is calculated by dividing the number of in-commuters by the total number of workers living both inside and outside the county.
High out-commuting rates were especially prevalent in Northern Virginia, closely tied to the Washington, D.C. metro area. Similarly, counties in Central Virginia, such as Caroline, King William, and New Kent, which are located between Richmond and Fredericksburg, also exhibit high out-commuting rates.
| Top 10 Localities with the Highest Out-Commuting Rates, 2022 | |||
|---|---|---|---|
Rank | County/City | Percentage | # of Out-Commuters |
1 | Manassas Park City | 94.7% | 7,486 |
2 | Fairfax City | 91.8% | 10,816 |
3 | Falls Church City | 91.3% | 5,966 |
4 | King and Queen County | 90.3% | 3,389 |
5 | Caroline County | 89.4% | 15,464 |
6 | King William County | 88.5% | 9,273 |
7 | Manassas City | 88.3% | 17,261 |
8 | New Kent County | 88.1% | 9,677 |
9 | Cumberland County | 88% | 4,051 |
10 | Clarke County | 88% | 6,991 |
Several cities in Northern Virginia, such as Fairfax City, Falls Church, Manassas Park, and Manassas, ranked high in both out-commuting and in-commuting rates, indicating a highly dynamic commuting pattern. Fredericksburg City also stands out, with its workforce commuting in from nearby counties like Spotsylvania and Stafford. Other localities such as Goochland County, Norton City, Williamsburg City, and Colonial Heights City also report high in-commuting rates; however, the actual number of commuters is smaller compared to larger jurisdictions.
| Top 10 Localities with the Highest In-Commuting Rates, 2022 | |||
|---|---|---|---|
Rank | County/City | Percentage | # of Out-Commuters |
1 | Fairfax City | 95.9% | 22,630 |
2 | Falls Church City | 94.7% | 10,231 |
3 | Goochland County | 91.5% | 18,984 |
4 | Manassas Park City | 91.4% | 4,447 |
5 | Williamsburg City | 91.3% | 10,479 |
6 | Fredericksburg City | 89.8% | 21,259 |
7 | Manassas City | 89.4% | 19,220 |
8 | Norton City | 87.6% | 2,992 |
9 | Colonial Heights City | 87.2% | 8,098 |
10 | Alexandria City | 87% | 73,197 |
Overall, the data shows that cross-county commuting is common in Virginia. In 2022, the median in-commuting rate in Virginia was 66.5%, with only 15 counties experiencing in-commuting rates below 50%. The median out-commuting rate was 75.9%, with only one locality (Montgomery County) experiencing an out-commuting rate below 50%. As a matter of fact, only two counties, Montgomery County (56%) and Smyth County (50%), had half or slightly more than half of their residents commuting locally within their home counties.
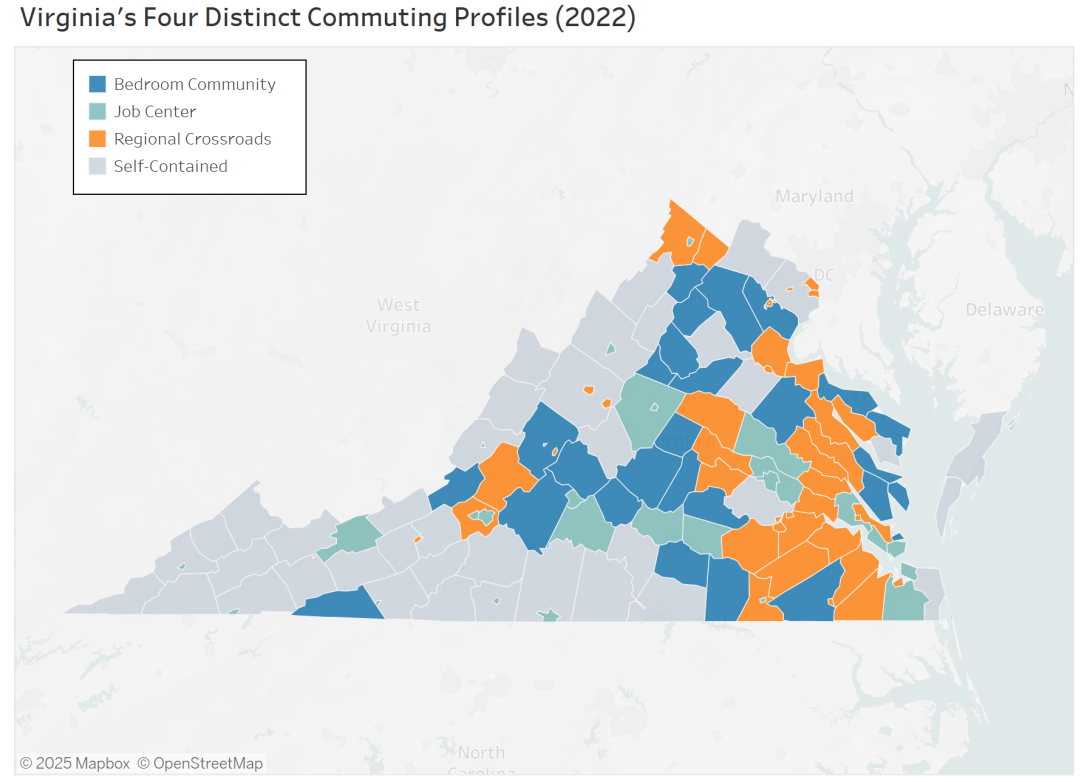
Categorizing Commuting Patterns: Four Distinct Profiles
To better understand the dynamics, we categorized localities based on the state’s median value of each out-commuting and in-commuting rate. For instance, if the out-commuting rate of the locality is higher than the median out-commuting rate and the in-commuting rate of the locality is lower than the median in-commuting rate, it falls into the category of a bedroom community. Accordingly, this approach reveals four distinct commuting profiles.
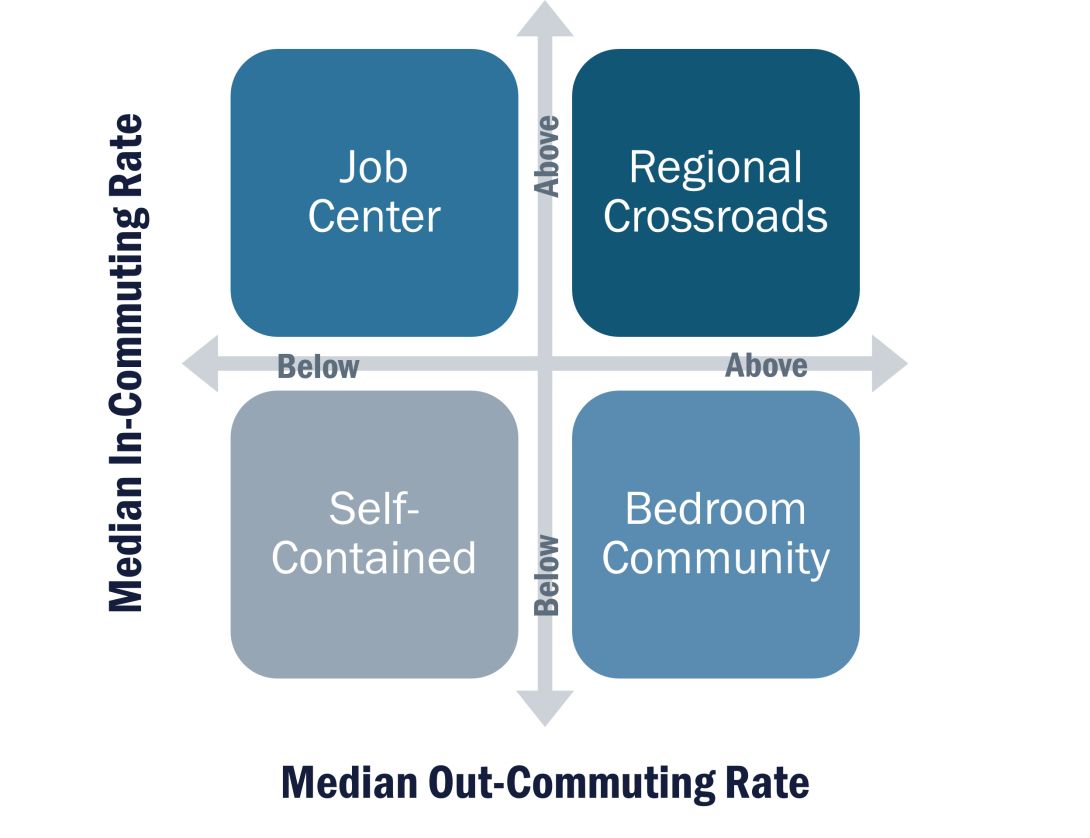
The Bedroom Community localities are primarily residential areas with limited local employment. Geographically, they are often located near metropolitan job centers or along major highways, offering residents more affordable housing while maintaining access to urban employment opportunities. In Virginia, 20% of localities fall into this category.
Job Center localities attract workers from surrounding areas and are often home to major employers. Most regions in Virginia have central cities or counties that serve as economic anchors for neighboring communities. In Virginia, 20% of localities fall into this category.
Regional Crossroads areas serve as both residential and employment hubs, with strong two-way commuting flows. Many localities in Northern, Central, and Hampton Roads fall into this category, attracting both in-commuters and out-commuters. In Virginia, 31% of the localities fall into this category.
Self-Contained localities have the lowest commuting flows in both directions, with many residents working locally. However, even among these counties, a majority of residents commute elsewhere. Most self-contained counties are located along Virginia’s borders in rural areas. In Virginia, 29% of the localities fall into this category.
Virginia's Commuting Patterns Dashboard