


U.S. Population Projected to Grow More Slowly through 2050
The Weldon Cooper Center has released a new vintage of population projections for the United States as a whole, all 50 states, and the District of Columbia. The product is benchmarked on the 2020 Decennial Census and the U.S. Census Bureau’s 2025 Population Estimates. The projections extend through 2050 and provide a consistent framework for examining future population outlook across states and regions.
National population growth remains positive but slower than in previous decades
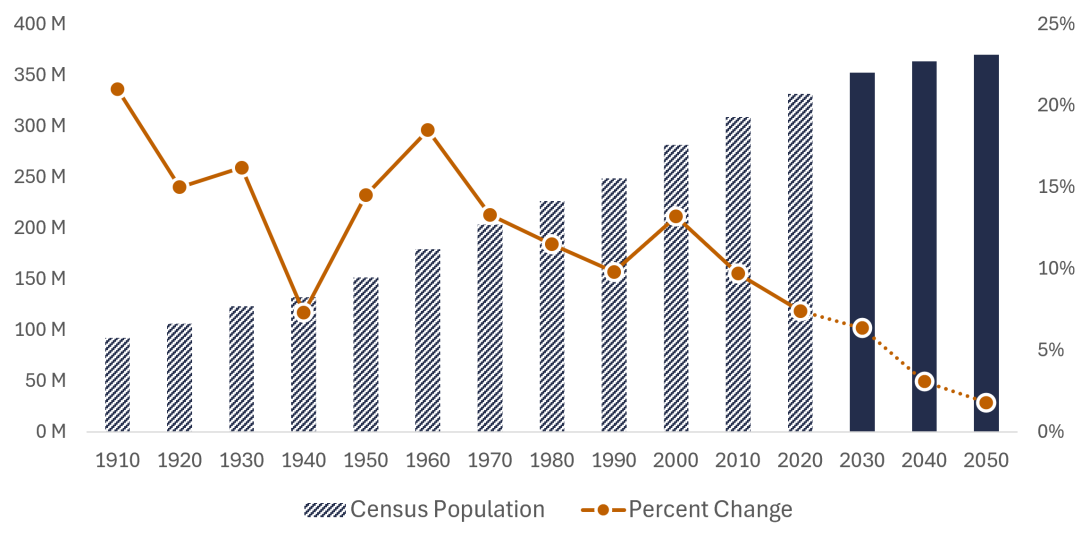
The U.S. population is projected to increase from 331 million in 2020 to 352 million in 2030 and approximately 370 million in 2050. Figure 1 places these national projections in historical context by showing both the size of the U.S. population and the percentage change for each decade from 1910 through 2050.
Population growth rates have generally declined since the 1960s, with a temporary increase between 1990 and 2000. The population is projected to continue growing by 2050, but at lower rates than historically observed. The projected growth rate declines from 7.4 percent over 2010–2020 to 6.3 percent over 2020–2030. After 2030, growth rates are projected to continue their downward trajectory, reflecting demographic trends, including low fertility, population aging, and recent migration dynamics. While no explicit assumptions are made about how these demographic components will change in the future, the projections implicitly assume that recent demographic trends will continue and will have a rippling effect on population change in the foreseeable future.
Figure 1. U.S. Census Counts, Projections, and Decennial Percent Change, 1910–2050
Population aging continues nationwide as the share of older adults increases
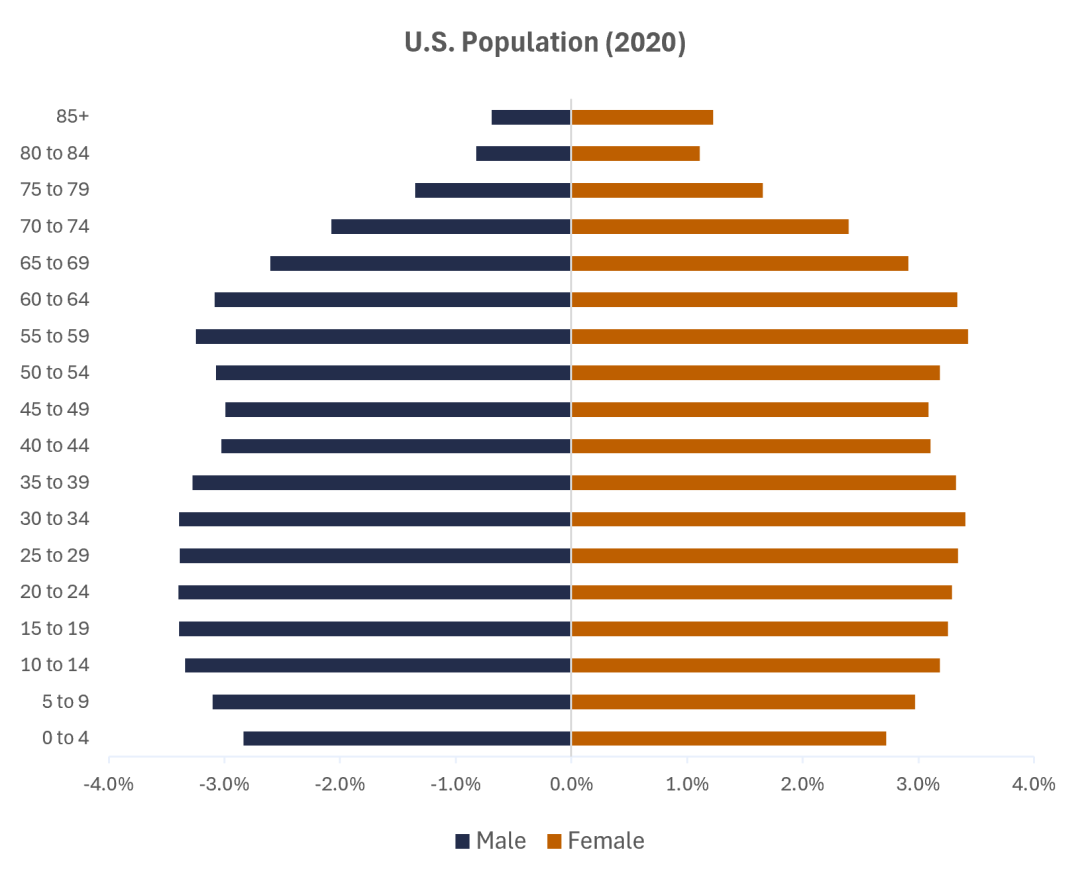
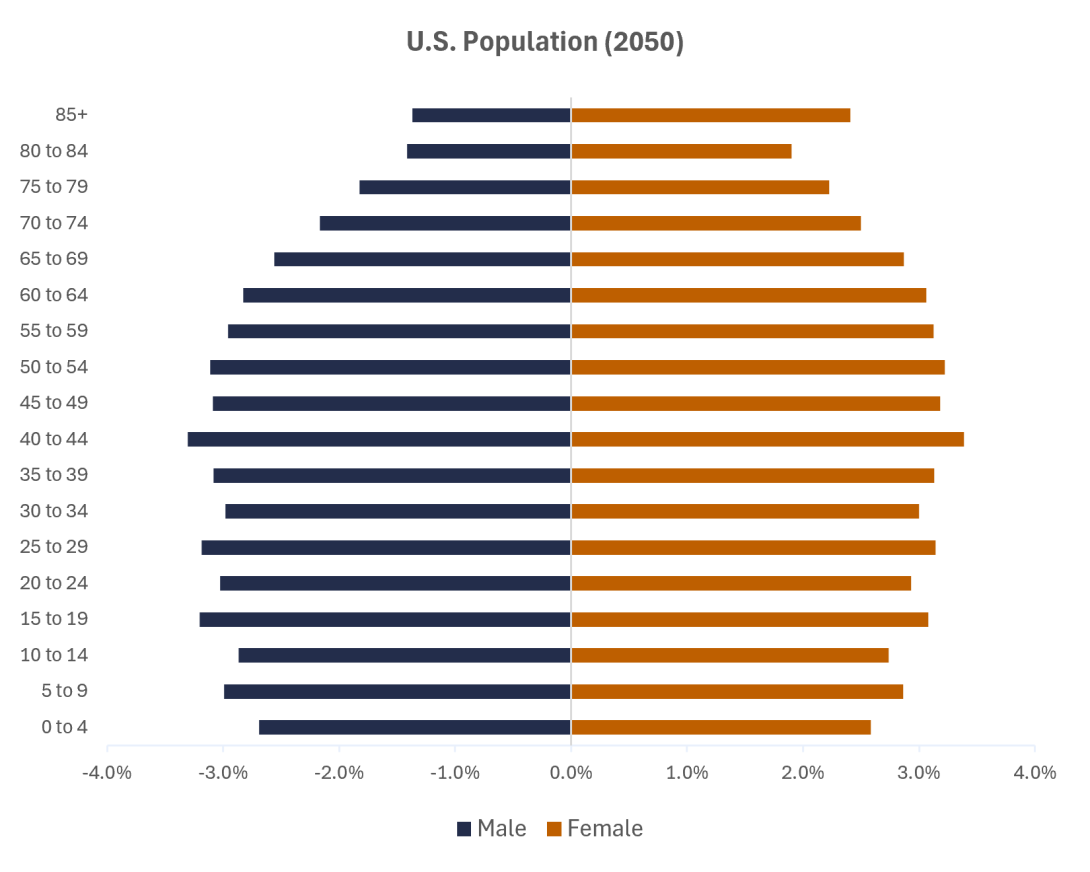
Changes in age structure are expected to play an increasingly important role in shaping the nation's demographic profile. The share of the population aged 65 and older is projected to grow steadily through 2050, reaching 21.2% of the U.S. population—about 78 million people. Meanwhile, the share of the population under age 45 is projected to decrease between 2020 and 2050. This pattern reflects declining birth rates observed over the past two decades, along with the assumption that they remain at current rates over the projection period. Consistent with this trend, the national median age is projected to rise from 38.8 years in 2020 to 41.9 years in 2050.
Figure 2 compares the age and sex distribution of the U.S. population in 2020 and 2050. The population structure in 2050 shifts toward older age groups, reflecting the continued aging of the nation. Compared with 2020, the 2050 population has a larger share of older ages, particularly among adults aged 65-84 and the oldest-old (ages 85 and above). The age distribution also becomes more rectangular in shape, indicating a larger proportion of the population concentrated in older age groups.
Figure 2. U.S. Population by Age and Sex, 2020 and 2050
At the state level, nearly one-quarter of the population is projected to be aged 65 or older by 2030 in Vermont, Maine, Hawaii, New Hampshire, and Florida. In 2020, Maine had the highest median age of 45.2 years, while Utah had the lowest at 32.8 years. By 2050, Maine is projected to remain the oldest state, with a median age of 48.7 years, while North Dakota is projected to have the lowest median age at 34.4 years.
The South accounts for a growing share of the nation's population
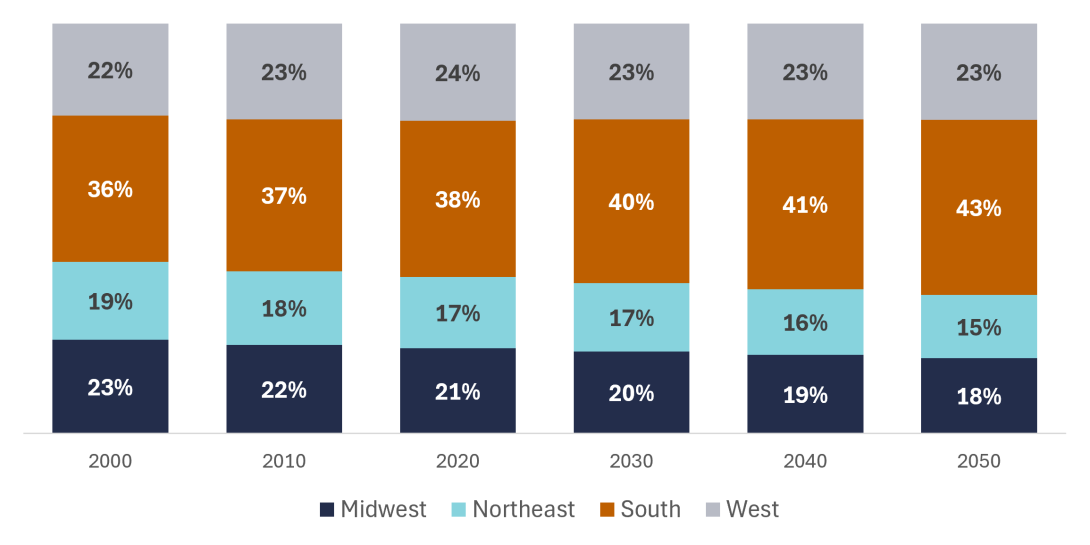
We analyzed regional population patterns using the current U.S. Census Bureau definition of regions. Since 1970, the South's share of the U.S. population has increased steadily, whereas the Midwest and Northeast have experienced sustained declines. Figure 3 shows the regional distribution of the U.S. population from 2000 to 2050. The South's share of the national population is projected to increase from 38.1 percent in 2020 to 42.7 percent in 2050. Over the same period, the Midwest's share is projected to decline from 20.8 percent to 18.4 percent, and the Northeast's share from 17.4 percent to 15.4 percent. In contrast, the West's share remains relatively stable, accounting for approximately 23–24 percent of the U.S. population throughout the projection period.
Figure 3. Regional Distribution of the U.S. Population, 2000–2050
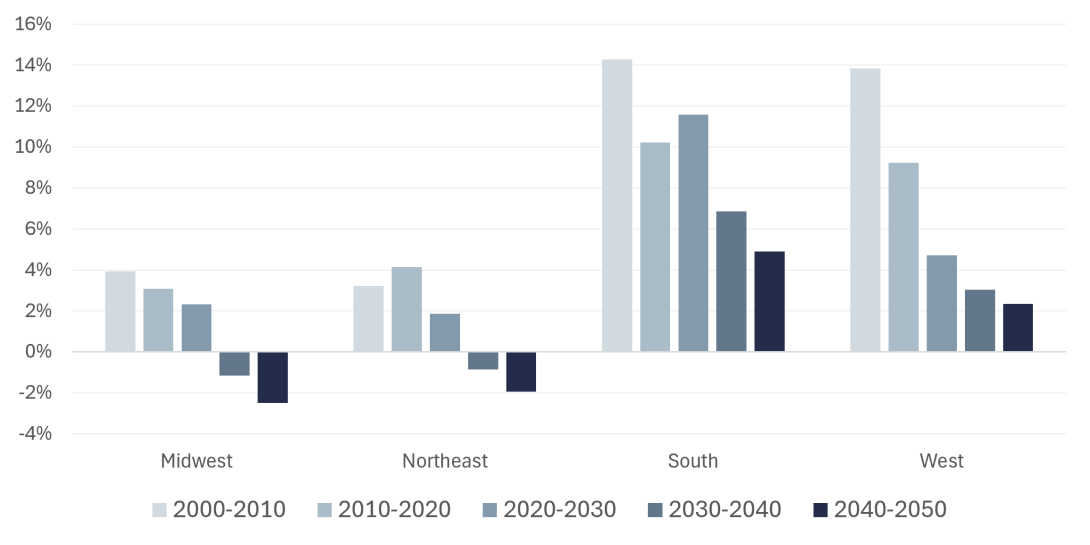
Projected growth rates differ across regions. Although growth rates generally decline over the projection period, the South is projected to grow slightly faster over 2020–2030 than it did over 2010–2020. The South remains the fastest-growing region throughout the projection period, followed by the West. In contrast, growth in the Northeast and Midwest between 2020 and 2030 is projected to be around 2 percent, leading to population decline in the following two decades.
Figure 4. Regional Population Growth by Decade, 2000–2050
To learn more about the methodology behind these projections or to download the data, visit the National Population Projections webpage.
