


Virginia School Enrollment Projections: 2026-2030
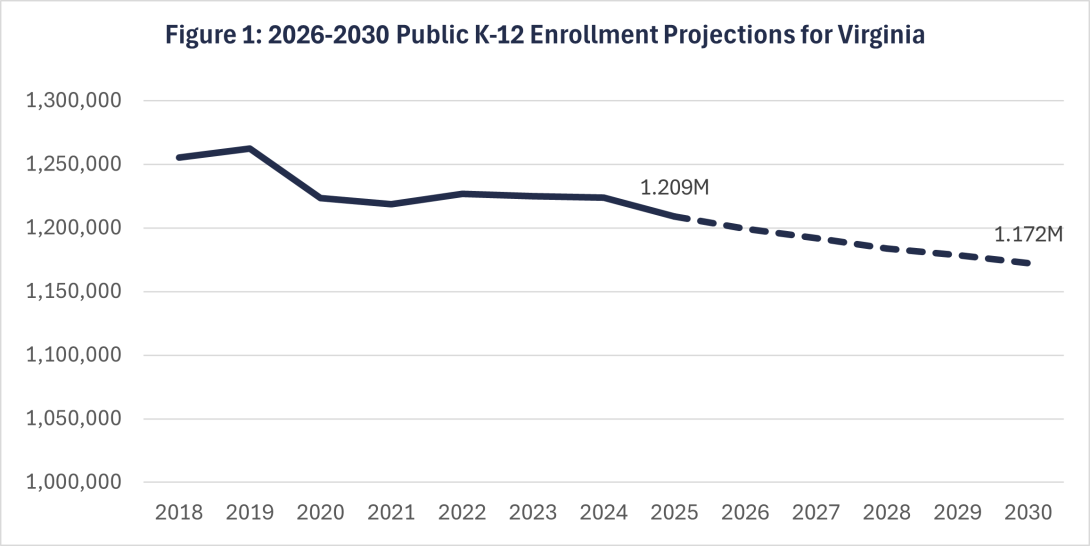
On February 25, the Demographics Research Group released public K-12 school enrollment projections for Virginia’s 131 school divisions for the next five school years (2026-2030), as well as projections of public school graduates and completers. These projections expect that Virginia’s K-12 enrollment will fall by 3% (36,827 students) from 1.209 million students in fall 2025 to 1.172 million students in fall 2030 (Figure 1).
In my previous post titled “Where is K-12 Enrollment Heading,” I discussed several trends that have shaped the trajectory of Virginia’s post-pandemic enrollment. In this post, I will explore how these trends and others influenced our latest projections.
What Changed in 2025?
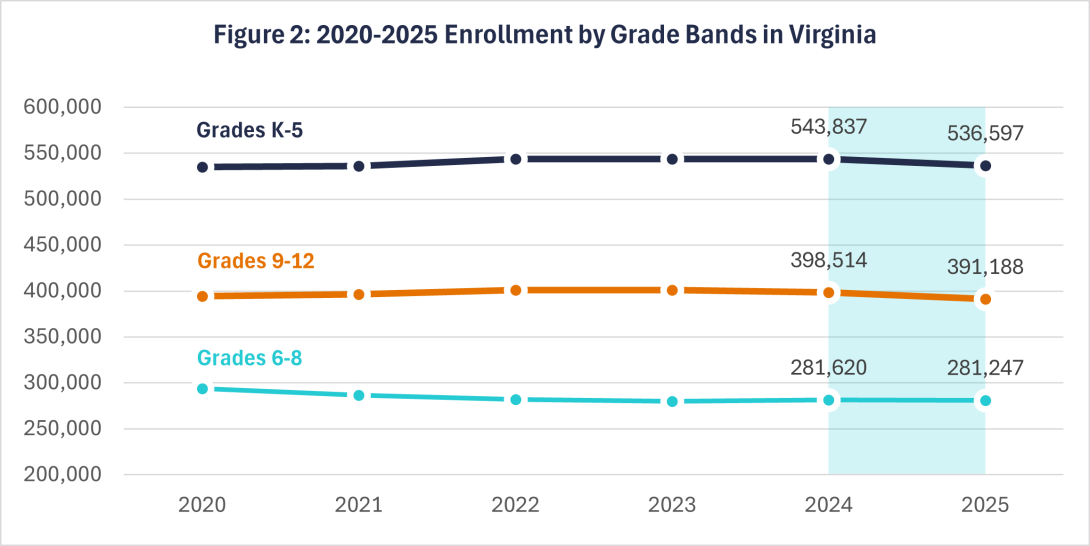
After losing nearly 40,000 students in fall 2020, Virginia’s K-12 enrollment hovered around 1.22 million students from 2021 to 2024. Breaking with that pattern, K-12 enrollment dropped by 14,939 students (1.2%) in fall 2025. This marked the second largest single-year loss in the past three decades and outpaced the 0.8% (10,029 students) decline we expected in our last round of enrollment projections.
Figure 2 shows how these losses affected each grade band. Grades 9-12 accounted for about half of overall decline (7,326 students or 1.8%), as Virginia’s largest graduating class was replaced by the smallest ninth grade class since 2001. Declines in grades K-5 (7,240 students or 1.3%) accounted for nearly the rest of the overall loss. Meanwhile, enrollment for grades 6-8 stayed relatively stable, declining by 0.1% (373 students).
Continued Recovery
Cohorts in grades K-4 in 2019 were disproportionately impacted by the pandemic, losing a total of 16,969 students as they moved into grades 1-5 in 2020. In my last post, I shared how these cohorts have been slowly recovering since then. By 2024, two of these cohorts were larger than they had been before the pandemic, and gaps to 2019 class sizes had substantially narrowed for the remaining three. Figure 3 shows that this trend continued in 2025 despite the sharp loss in overall enrollment. Three cohorts now exceed their pre-pandemic class sizes, and the remaining two have moved closer to their 2019 levels.
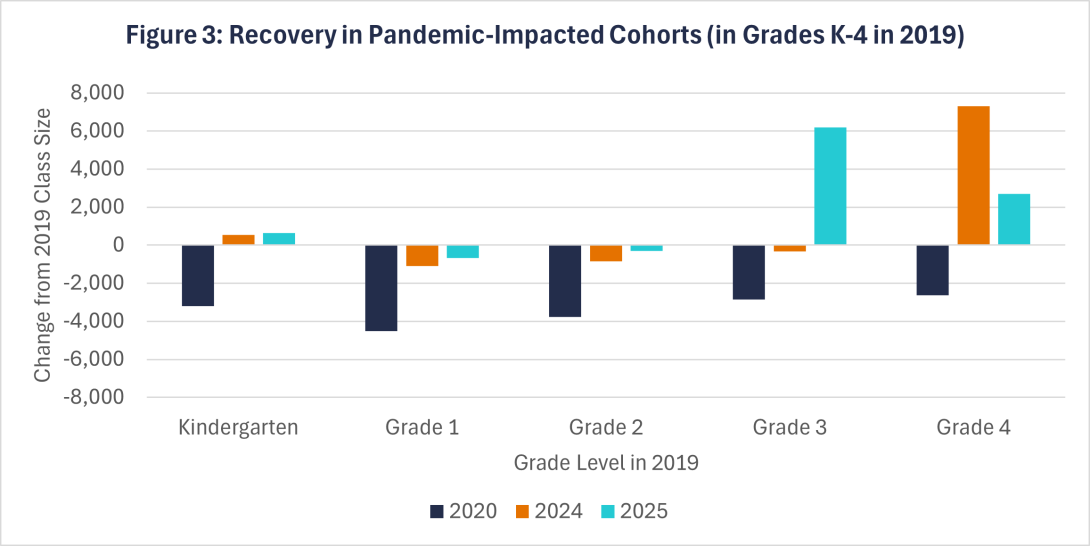
Recovery in these cohorts initially helped stabilize K-5 enrollment, which had been steadily falling from 2015 to 2019. This effect is now more visible in grades 6-8, as the last of these cohorts began middle school in 2025.
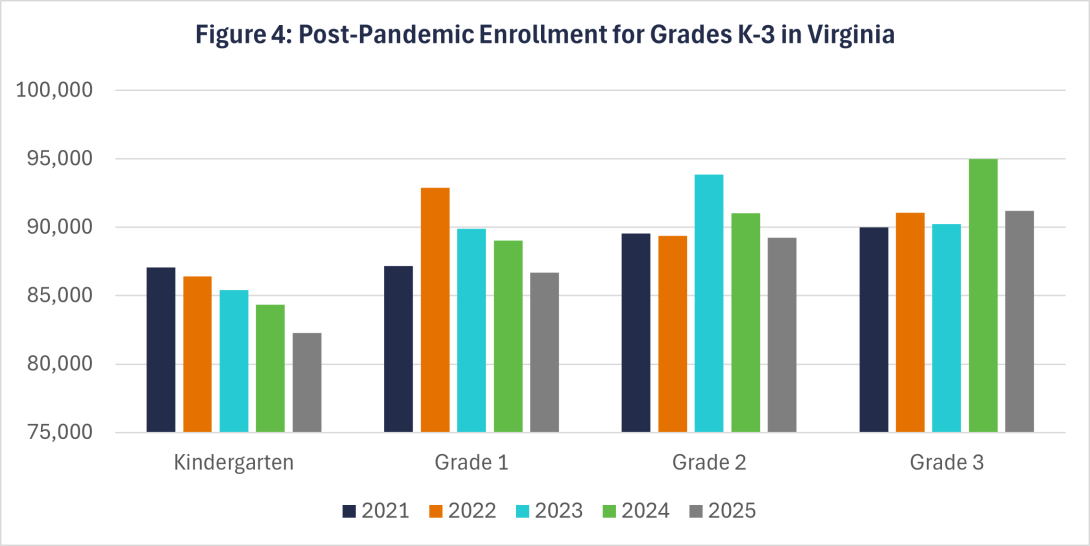
In a pattern nearly identical to the pre-pandemic years, the movement of these larger, recovering cohorts out of grades K-5 exposed growing cracks in this grade band. Kindergarten class sizes rebounded by 8% (6,471 students) in 2021 after reaching a three-decade low in 2020. Class sizes have decreased every year since then, and at a faster rate compared to when this trend first took shape in 2014. Figure 4 illustrates the downstream impact of shrinking kindergarten classes, as the smaller cohorts that began school after 2021 have produced a clear “stair-step” pattern of decline that has spread to grades 1-3.
A Closer Look at Births
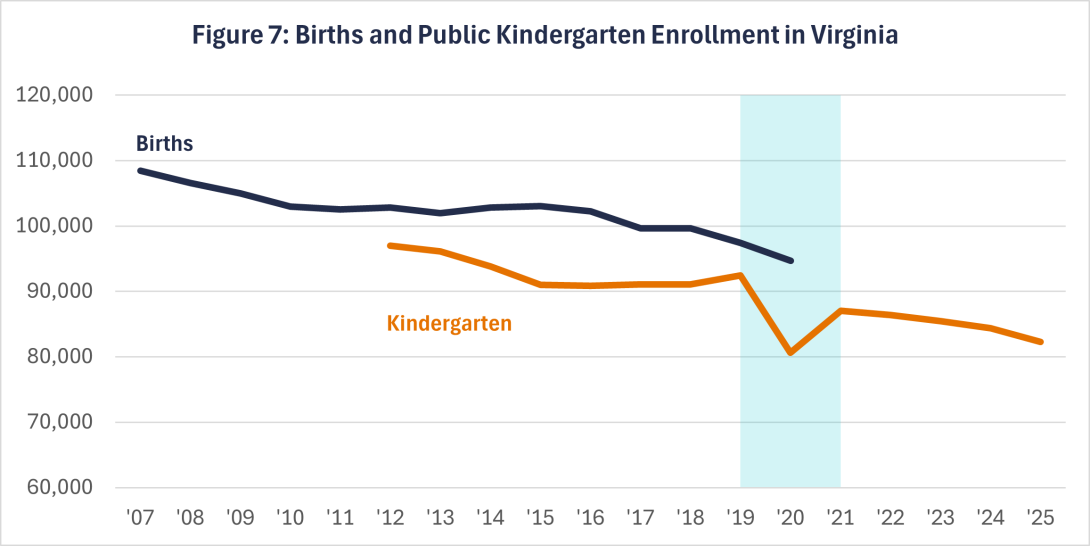
There is no mystery behind the stair-step pattern mentioned above. Annual births began falling in 2008 after reaching a peak of 108,416 the year before. As a result, kindergarten enrollment noticeably dropped in 2014, and this decline has moved into higher grades with each passing year.
Considering birth’s dominant influence on recent enrollment trends, it is useful to “zoom out” on how births shape the K-12 trajectory and how the current downturn in births differs from others.
First, the number of children born each year largely determines the size of the cohort that will begin kindergarten five years later. In turn, kindergarten has an outsized influence on overall enrollment, as cohorts tend to stay within a relatively narrow range of their kindergarten class size as they progress through grades 1-12. Figure 5 shows that cohorts graduating between 2015 and 2019 remained, on average, within 4% (about 3,700 students) of their kindergarten class size. That gap has substantially narrowed to 0.9% (850 students) since 2020.
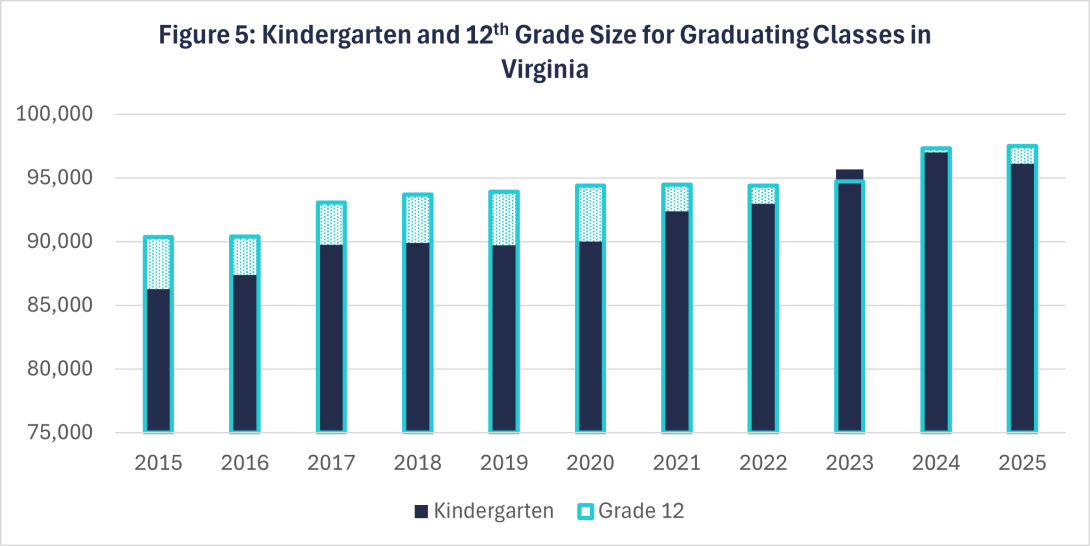
Figure 6 shows annual births in Virginia for the past five decades, with areas shaded in light blue indicating periods of decline. One aspect makes the current downturn stand out: duration. Because declines in the 1970s and 1990s were shorter and followed by periods of sustained growth, they had a more limited impact on school enrollment. For example, declining births from 1991 to 1997 only produced five noticeably smaller cohorts. Births began rising again in 1998, causing kindergarten enrollment to rebound in 2003. The larger cohorts that began school afterward quickly offset earlier decline and made the impact of this downturn virtually invisible at the K-12 level.
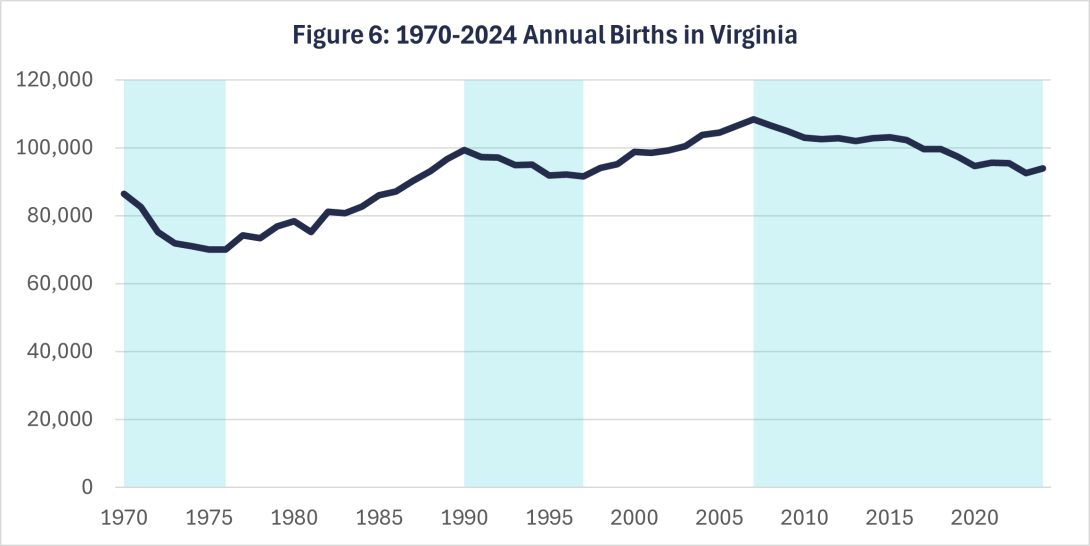
By contrast, births have fallen in 11 of the past 17 years of available data, with the number of children born in 2024 trailing the 2007 peak by 14,422 (13.3%). Kindergarten enrollment started to fall in 2013, although the cohort that entered that year was still exceptionally large. Impacts became clearer in 2014, when kindergarten enrollment fell by 2.4% (2,306 students). Excluding 2020 and 2021, kindergarten enrollment has fallen at an average annual rate of 0.8% since then, representing a loss of about 700 students each year. In fall 2025, the first cohort impacted by the current, prolonged downturn reached the 11th grade, with progressively smaller cohorts filling grades K-10.
The Next Five Years
The three factors mentioned in this post shaped our 2026-2030 state-level enrollment projections, although the extent of their influence varied.
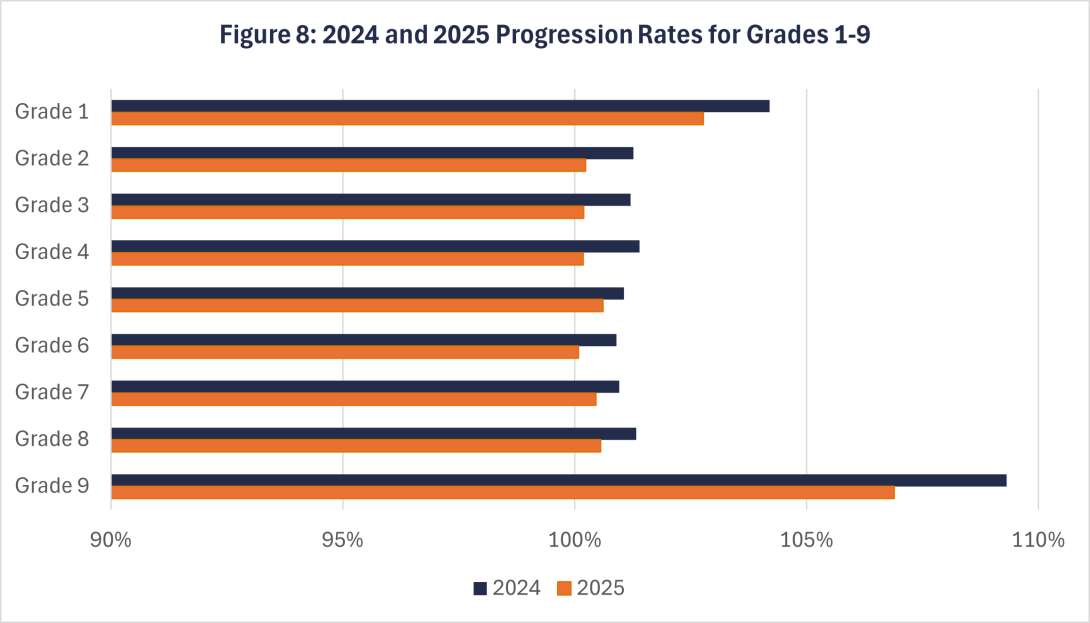
Grade progression ratios (GPRs) measure how cohorts change as they move from one grade to the next and are used to project enrollment for grades 1-12. GPRs above 100% indicate that a cohort grew as it progressed, while GPRs below 100% indicate that it shrank. The sharp decline in K-12 enrollment seen in 2025 pushed progression rates downward, especially for grades 1-9 (Figure 8). Cohorts are still projected to mostly grow as they move into higher grades, but weaker 2025 GPRs reduce the expected growth rate. For example, the ninth grade GPR fell to a nearly three-decade low of 106.3% in 2025, as the cohort entering this grade added 1,902 fewer students than the cohort that entered in 2024. As a result, this round of projections expects that cohorts will grow by about 8.2% as they enter ninth grade, down from the 9.5% growth rate expected in our 2024-2028 projections.
Recovery in cohorts that began grades 1-5 in 2020 initially helped stabilize K-5 enrollment and is now having a similar effect on grades 6-8. Projected losses for grades 9-12 show that, even if these cohorts continue to regain students, they will not be able to fill the large gaps left by the next three graduating classes. For example, the first of these cohorts had regained 2,710 students as it began the 10th grade in fall 2025. Despite this, it still trailed the previous 10th grade class by 2,938 students. This gap is projected to widen to 3,160 students by the time this cohort reaches the 12th grade in 2027.
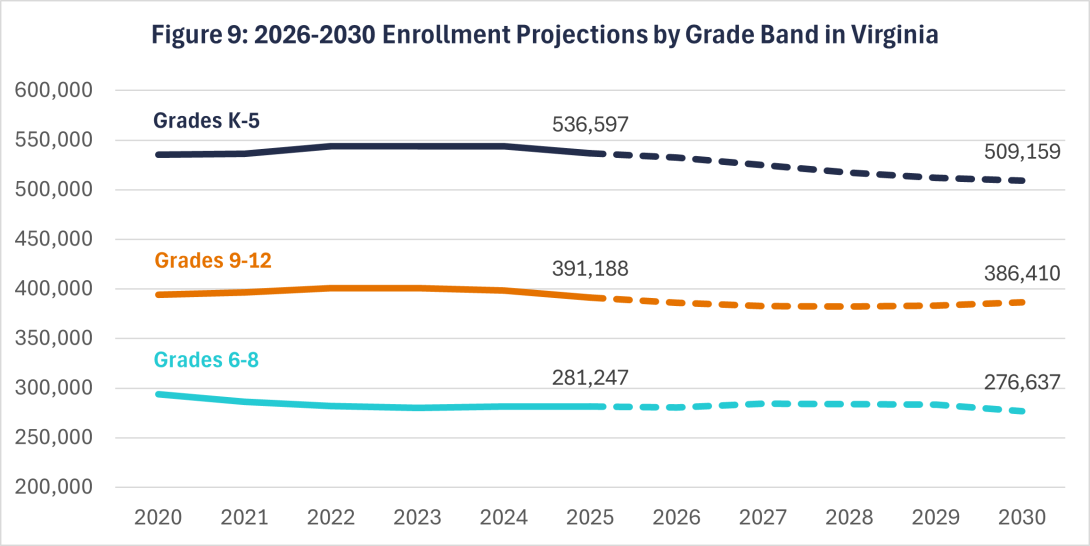
The influence of these two factors pales in comparison to declining births, which continue to dominate the trajectory of Virginia’s K-12 enrollment. Since the impact of this trend became evident with the 2014 kindergarten class, it has affected K-12 enrollment from the “bottom-up,” as smaller cohorts have mostly replaced larger ones as they moved through higher grades. Figure 9 above shows that, as births have mostly continued to decline, the same pattern will play out over the next five years.
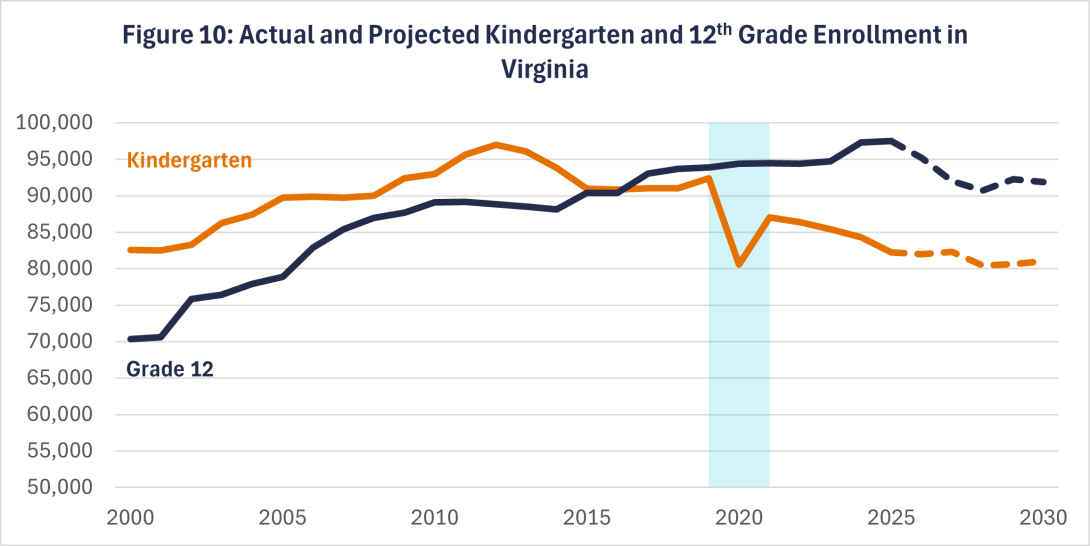
Fall 2026 will mark the point when the impact of declining births reaches every grade. This milestone will introduce a new dynamic, in addition to driving bottom-up decline. Figure 10 revisits the comparison between kindergarten and 12th grade from my last blog post. For decades, the number of children entering Virginia schools outnumbered graduating students, setting the stage for sustained growth. These two lines intersected in 2017, and the gap has since widened as kindergarten classes shrank and larger pre-2014 cohorts swelled the 12th grade. Projections expect the 2014 cohort will lag the current graduating class by 2,370 students when it reaches 12th grade next fall. At that point, the gradual decline that began 13 years ago will come “full circle,” with 12th grade enrollment expected to fall by 5.8% (5,614 students) over the next five years.
Context is Key
A new paradigm for Virginia’s school enrollment has emerged since the pandemic, breaking from the three decades of nearly uninterrupted growth that preceded 2020. Differences between this new trajectory and past trends have been sensationalized by the media and framed as the impending “enrollment cliff.” While the changes described in this post will have real impacts, they do not mean that Virginia’s educational system is careening toward a dystopian, unprecedented future.
Placing recent changes in historical context helps to clarify both the scale of what has occurred and what projections expect. Because 2019 was the last “normal” year before the pandemic, it serves as a natural benchmark for current enrollment. Enrollment that year was unusually high, however, as a group of large cohorts pushed K-12 counts to a peak of 1.26 million students. As a result, comparisons to 2019 make recent declines seem dramatic, with fall 2025 enrollment trailing 2019 by 53,417 students. While these gaps may suggest that Virginia’s school system has entered uncharted territory, current enrollment has largely returned to levels seen in the late 2000s. Projections expect that 2030 enrollment will align more closely with levels from the early 2000s.
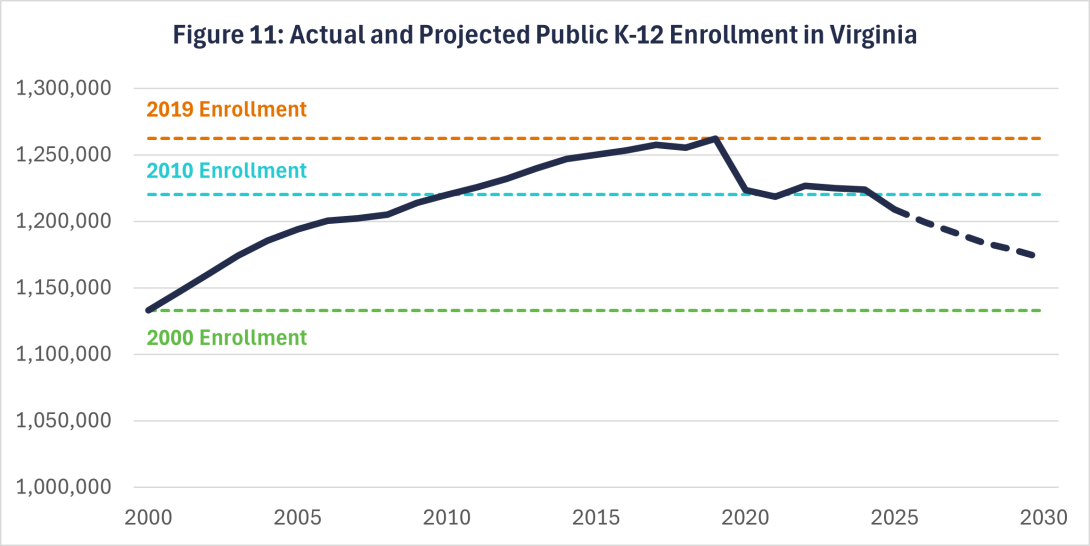
In other words, the 3% (36,827 students) decline projected over the next five years resembles a retreat from Virginia’s surging enrollment in the 2010s rather than a sudden freefall. These changes will certainly require some adjustments, but not a complete overhaul of the state’s education system.