


Virginia School Data
View all population data
School Enrollment Projections
- School Enrollment Projections K-12, 2026-2030 | February 26, 2026
- School Enrollment Projections, Graduates and Completers, 2026-2030 | February 26, 2026
- Methodology | web-friendly version below
- Zach Jackson: ten2se@virginia.edu | contact for questions and feedback
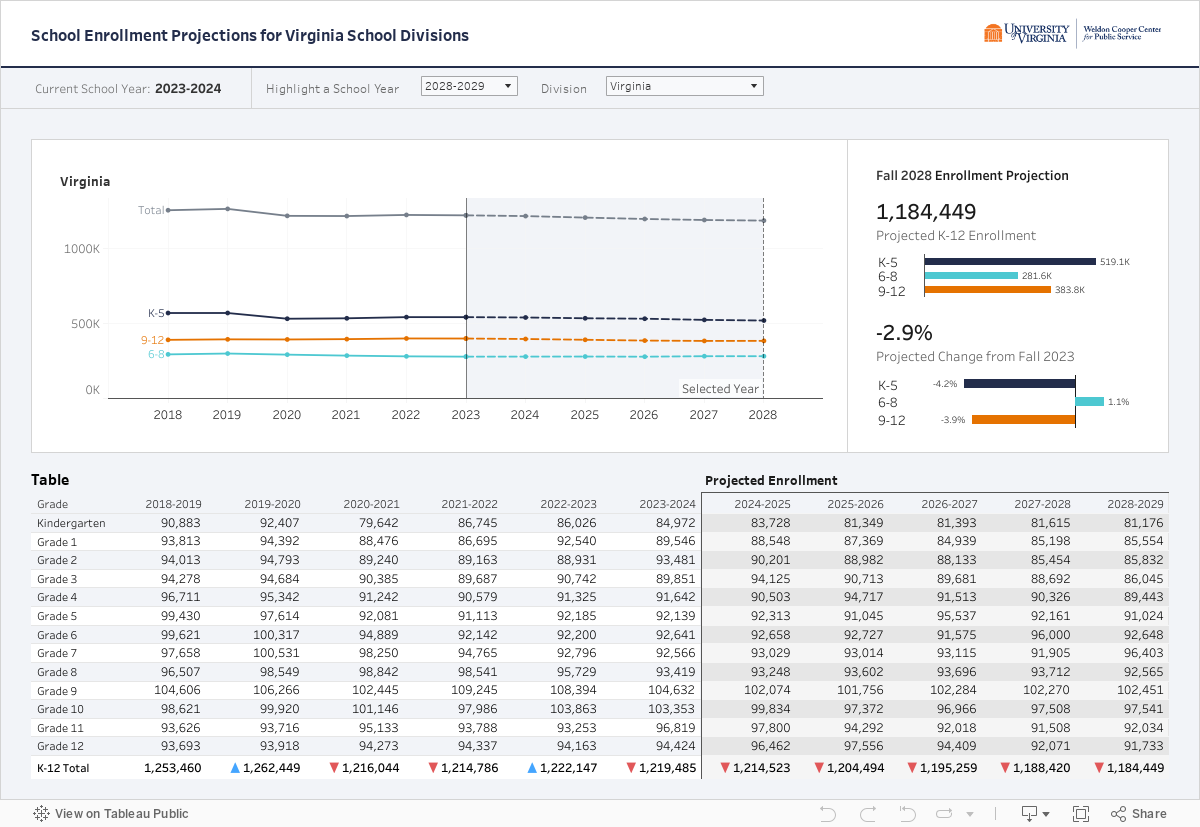
- Why Enrollment Projections Are Important
School enrollment projections help school leadership anticipate upcoming need for classrooms, teachers, and materials, and influences capital construction, school district alignment, bus routes, and the efficient operation of school divisions. Developing projections that are uniform across divisions and making them freely available regardless of divisional funds is critical for planning in Virginia’s public schools.
- Methodology
This document describes the methodology used by the Weldon Cooper Center for Public Service Demographics Research Group to project by-grade public K-12 enrollment and public school graduates and completers for each of Virginia’s 131 school divisions for the next five school years, 2026-2030.
Input Data
School enrollment projections require the use of fall membership counts and birth data. Historical and current fall membership counts record the number of students enrolled in each school division as of September 30th. These data are obtained from the Virginia Department of Education (VDOE).
In addition, VDOE provides enrollment data for students enrolled in “multidivisional online provider” (MOP) programs, in which school divisions partner with a third party to offer full-time virtual schooling. MOP students primarily reside outside offering divisions, and divisions’ capacity to enroll these students can fluctuate from year to year. Because these factors can distort enrollment projections, MOP enrollment is used to remove non-local virtual students from participating divisions’ enrollment counts. As a result, non-local MOP students are not considered in division-level projections.
Alternatively, non-local MOP students were included in the state-level enrollment projection as they are nevertheless Virginia students. The 2025 count of non-local MOP students was held constant over the five-year projection period due to difficulties in projecting MOP enrollment.
Finally, birth data obtained from the Virginia Department of Health are used to project kindergarten enrollment. Cooper Center demographers geocode the residence address of each birth mother to ensure that birth data have been assigned to the correct localities.
Grade Progression Ratio (GPR) Method
School enrollment projections use past school enrollment trends to forecast future school enrollment, under the assumption that these trends are likely to continue in the near future. Grade progression ratios (GPRs) capture enrollment trends by measuring the rate at which cohorts of students progress from one grade to the next. For grades 1-12, GPRs are calculated by dividing the number of students enrolled in a particular grade by the number of students enrolled in the previous grade and school year.
The kindergarten GPR represents the rate at which eligible children (typically at least 5-years-old at the beginning of a school year) enrolled in kindergarten. This ratio is determined by dividing actual kindergarten enrollment by the number of children born within a school division’s boundaries five years prior. For example, 2026 kindergarten GPRs were determined by dividing 2025 kindergarten enrollment by the number of children born in 2020. In addition, the graduate ratio is calculated by dividing the number of graduates and completers at the end of a school year by grade 12 enrollment at the beginning of the same year.
GPRs capture the impact of school transfers, migration, and dropouts. GPRs greater than 1.0 mean that the number of students enrolled in a grade is greater than those of the previous grade one year prior. Alternatively, GPRs less than 1.0 indicate that fewer students progressed from the previous grade into the next grade. Year-to-year fluctuations in GPRs can obscure school enrollment trends. Therefore, multiple GPRs are often combined into a single measure to “smooth” these fluctuations.
The 2026-2030 projections use GPRs derived from 2022-2025 enrollment data to project enrollment for grades K-12 and public school graduates and completers for all Virginia school divisions.
Control Totals
Projecting school enrollment at the state-level typically yields a more accurate and reliable enrollment forecast than at the school division-level. Therefore, division-level grade projections are controlled to state totals by applying adjustment factors that marginally lower or increase the number of projected students. The combined effect of these small adjustments makes the sum of all division-level projections for a given grade match the corresponding state total.
- Customized School Enrollment Projection Studies
Comprehensive, customized studies that incorporate local population dynamics, housing trends, and other data to provide a more in depth understanding of enrollment projections are also available. Fees for such studies vary, depending on the scale and complexity of the project. Contact: Zach Jackson: ten2se@virginia.edu.
School-Age Population Estimates
- School Division Estimates (July 1, 2025) | View our methodology
- Town Estimates (July 1, 2025) | View our methodology
- Kent Pugh: nhh9rn@virginia.edu | contact for questions and feedback
School-age population estimates are required by the Code of Virginia to distribute sales and use tax among the school divisions of Virginia. These data, produced annually by the Weldon Cooper Center, estimate the current 5- to 19-year-old population of each school division and town in Virginia. Each year, 1.125% of the state sales and use taxes is distributed to Virginia’s 135 school divisions according to these data.
- Review and Inquiry Process
All estimates are provisional until September 30th of each year when they become final.
The Weldon Cooper Center school-age population estimates are based on a carefully developed methodology for estimating those persons ages 5-19 in Virginia school divisions and towns. School division, locality, or town representatives wishing to request a revision to the estimates are encouraged to read the Methodology documents as a first step: https://coopercenter.org/virginia-school-data
Once you have reviewed the estimates and the appropriate documents, you may request a revision to the school-age population estimate if any of the following three circumstances apply:
- Your division, locality, or town representatives derive substantially different estimates of the local 5-19 population, and you can provide credible and verifiable supporting data showing public-school, private-school, and home-schooled enrollment counts.
- Your division, locality, or town representatives have identified an error in the school-age population estimate input data or computation.
- Your division, locality, or town representatives have challenged the 2010 decennial census count through the Count Question Resolution Program and have received notice from the United States Census Bureau of a change to that count. Because Cooper Center estimates are benchmarked on the decennial census, this additional information is critical for our method.
Notify the Weldon Cooper Center by September 30 if you have questions about an estimate or feel a revision of an estimate is necessary. Please do not submit supporting data until you have discussed the data requirements with us. After September 30, the estimates will be considered final and will be used to allocate to school divisions 1.125% of the state sales and use tax and to apportion allocation of the local option sales tax. The contact person is Hamilton Lombard: hamilton.lombard@virginia.edu.


